 .
.
By the time that WFCAM comes on line, the basic geometry and mass power spectrum of the universe will have been established through observations of the microwave background and local galaxy redshift surveys on scales of >> 100 Mpc.
The key issue will then be to understand how galaxies form and how they evolve. The DXS survey is designed to create a data set for galaxies at 1<z<1.5 that is directly comparable to the 2DF and Sloan surveys at z=0. We already know that the universe at z=1 is very different from the local universe. In particular, the average rate of star formation declines by almost an order of magnitude over this redshift range. We can determine the driving force behind this decline by quantifying the evolution of the clustering of galaxies, through measurement of the correlation function or the power spectrum and its dependence on colour and galaxy magnitude. One possibility, that is suggested by hierarchical models for galaxy formation (e.g. Cole et al., 2000), is that it is the changing environment of galaxies. On the other hand, classical galaxy formation models suggest that the decline results from galaxies consuming the internal reservoir of gas. By probing colours of galaxies as a function of their environment we can identify which of these scenarios is correct. By using the correlation function, we can probe the full range of galaxy environments from isolated galaxies to galaxy groups; not just galaxies in rare clusters.
The challenge, however, is to invert the correlation function of
galaxies to extract the information about the numbers of galaxies
found in a halo of a certain mass M; and to map the function's
dependence on galaxy colours and magnitudes. This function is commonly
referred to as the ''halo occupation number'' (Nh(M)) and
is easily calculated in any flavour of galaxy formation model. The
inversion problem is extensively discussed in Benson (2001). It
clearly requires good knowledge of the mass power spectrum. But
substantial progress has already been made from the 2dF survey
(e.g. Peacock et al. 2001) and from cosmic microwave background
experiments. Particularly in the field of microwave background
studies substantial progress will be made with the MAP satellite so
that in 2005, the mass fluctuation power spectrum will have been
measured. The ratio of the galaxy correlation function to the mass
correlation function defines the bias,  .
.
Benson (2001) shows that the correlation function depends not only on the mean Nh(M), but also on its variance. There are two strategies for relating Nh(M) and bg(r): (1) adopt a trial galaxy formation model to compute Nh(M), and then predict bg(r); (2) invert bg(r) under a minimal set of assumptions. Method (1) has received most attention (e.g. Benson et al., 2001), but has only been tested for a limited set of models so far: it is an extremely powerful test, but the models which have failed do not get published! It is vital that we take a long term view: by 2005 a much greater variety of galaxy formation models will be available (e.g. Benson, Bower et al., are developing models in which gas cooling is regulated by heating the X-ray haloes - see Bower et al. 2001 for an introduction; Ostriker et al., and Pearce et al., have numerical models that assume physics that is different again). In any case, by 2005, it is reasonable to expect a formalism for direct inversion of bg(r) to exist. Although these theoretical techniques are in their infancy, the observational programme to match these developments should be set in motion now.

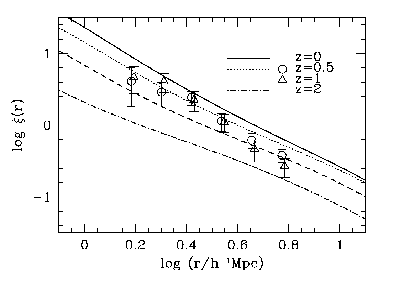
Figure 5.2. Comparison of dark matter clustering
(lines) with galaxy clustering (symbols), extracted from a
semi-analytic model (Cole et al. 2000). Note that the dark matter
curves are at four different epochs, whereas the galaxies are plotted
only for z=0.5 and z=1. The simulation represents a volume of only
1-2% of the proposed DXS survey, and therefore results in relatively
poor statistics on both large and small scales. Note the
scale-dependent bias, and the fact that the bias seems to change with
epoch.
To demonstrate the observational requirements we turn to the predictions of the latest semi-analytic models which incorporate the results from N-body simulations (see Figure 5.2). These suggest that to address the question of bias we need to adequately sample scales of order 100 Mpc, or a few degrees across at z>1. Figure 5.2 shows the predicted change in mass correlation against that determined from semi-analytic models for the galaxy correlation at z=0.5 and 1. In order to limit the effects of cosmic variance we need to observe three separate fields.
What area do we need to survey to match the volume of the 2dF galaxy redshift survey? To a depth z=0.2 the volume of the 2dF survey is 1.7X10⁸ Mpc3. For DXS the volume element for the redshift interval 1<z<1.5 is 4.8X10⁶ Mpc3 for 1 sq. deg. So a survey over 35 sq. degs matches 2dF. Coincidentally this is the same as the area requirement for the clusters survey. Initially we would rely on photometric redshifts to slice the volume into thin redshift slices dz~0.2, inverting angular quantities to obtain the real-space clustering. However preliminary planning for a sparse-sampled redshift survey of 105 z>1 galaxies with FMOS has begun, which will allow a much wider range of clustering analyses (see section 5.5).