The redshift seven barrier
The combination of SDSS and 2MASS data has recently created
considerable interest by breaking the long-standing z=5 quasar
barrier, and indeed reaching z=5.8 (Fan et al. 2000). Finding quasars
to even higher redshifts is of considerable importance for several
reasons:
- To detect the epoch of reionisation, or place a more stringent
lower limit to z(rei).
- In the event of detection of a quasar of redshift z>z(rei),
to probe the neutral IGM before reionisation through measurement of
the inverse effect, as well as the detection of the predicted Ly-alpha
halo around the quasar (Heep et al. 2000; Loeb & Rybicki 1999).
- To measure the decline of the quasar luminosity function with
lookback time. The measurement of the space density of bright quasars
at very high redshift provides a sensitive test of theories of
structure formation (Haiman & Loeb 2001). The luminosity function also
quantifies the contribution of quasars to the ionising background.
- To provide targets for the detection of neighbouring galaxies
and structures at the same very high redshifts.
The epoch of re-ionisation. Perhaps the most exciting
reason for searching for very high redshift sources, and much of the
motivation for the construction of NGST, is due to the hope of
detecting and studying the epoch of reionisation. The transition from
isolated HII regions around bright sources at early times, through the
period of overlap of the ionised regions, to almost complete
reionisation of the IGM is predicted to be very rapid, lasting only
10% of the Hubble time (Gnedin 2000). The transformation, then, is of
the nature of a phase transition, and marks an era of fundamental
significance in the history of the Universe. The reionisation epoch
z(rei) is predicted to occur within the redshift range
7<z(rei)<12. Detectable flux in the Ly-alpha forest (i.e. the
absence of a Gunn-Peterson trough) in the spectrum of the most distant
known quasar at z=5.8 (Fan et al. 2000) places a lower limit on the
epoch of reionisation at the emission redshift of this quasar. With
the LAS we aim to reach z=7.2 and possibly even higher.
Need for a new quasar selection technique. The
multicolour technique for finding high-redshift quasars requires three
filters, one containing the quasar's Ly-alpha emission line, one
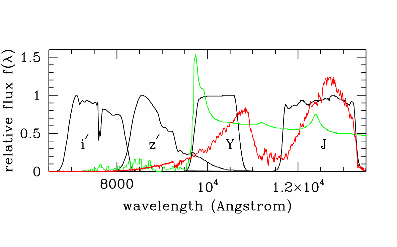
blueward (the dropout band), and one redward (See Figure 2.2). Fan et
al. (2000) combined i' and z' from SDSS data with the 2MASS J
filter. The shallowness of the 2MASS J survey (J=16.7) means that this
technique uses only a fraction of the SDSS data, down to z'~18.8,
compared to the survey limit of 19.9. With the LAS survey limit of
J=20, we will match the SDSS better and will find greatly increased
numbers of z=6 quasars, and probe further down the luminosity
function.

Figure 2.2.Illustration of drop-out method for
finding quasars, and the proposed new Y filter. The green line plots a
model spectrum of a typical quasar of redshift z=7. The red line shows
the spectrum of the T dwarf SDSS1624 (Leggett et al. 2000b). The
filter transmission curves (including atmosphere) are plotted
black. For i', z', these are based on the latest SDSS measurements in
Fan et al. (2001b). The gap between Y and J is a region of strong
atmospheric absorption.
However even with deep J data, the i'z'J method breaks down beyond
z=6, because the quasars become rapidly redder and much fainter in z',
so will have only upper limits in z', and so will be
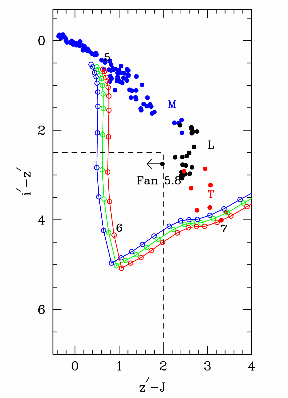
indistinguishable from T dwarfs. This is illustrated in Figure 2.3
(left) and is also clear from Figure 2.2. We have undertaken a
methodical study of filter choice for finding z>6 quasars. This is
described in Appendix A, but a brief summary follows.
One might imagine that z'JH or z'JK is the obvious choice. However,
using z' with any combination of J, H, K is not satisfactory as
quasars have very similar colours to cool stars over the redshift
range 6<z<7.2, and beyond z=7.2 are extremely faint in z'. At
z=7 we predict z'-J=3, so that to match J=20 requires a survey z'~23,
much deeper than SDSS. Instead of relying on z', imagine shifting the
central Ly-alpha to a band between z' and J. We call this proposed
new band the Y band, covering 0.97-1.07 micron, as shown in Figure
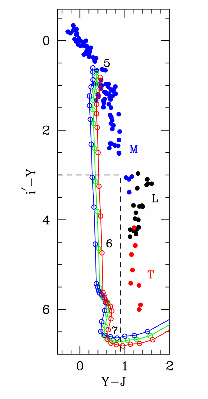
2.2. Figure 2.3 (right) shows the i'YJ two-colour diagram, showing
that we can distinguish z=6-7 quasars from T-dwarfs clearly, if we
survey to a depth Y=20.5. In the longer term our aim would be to
envisage a large area very deep z' survey, perhaps with VISTA, to
probe the region z=7-8.


Figure 2.3.Two-colour diagrams used for finding
high-z quasars. The blue circles are main sequence stars in the
Gunn-Stryker atlas, as well as cool M dwarfs, down to M9.5, from
Leggett et al. (2000a, 2001). The black circles marked L and the red
circles marked T are brown dwarfs taken from Leggett et al. (2000b,
2001). The open circles are the modelled colours of quasars in the
redshift range 5<z<8 in steps of dz=0.1, and with three
different continuum slopes from hard to soft, represented by blue,
green, and red lines. LHS: i'z'J diagram as used by
Sloan for finding quasars in range z=5-6. This illustrates how quasars
become hard to distinguish from T-dwarfs by z=7. RHS:
i'YJ diagram using the proposed new Y filter, and the selection
box that could be used to find quasars in the range z=5.8-7.2.
| 4000 deg2
Y<19.0
5.8<z<7.2
| 4000 deg2
J<19.5
7.2<z<8.0 |
| Fan et al. | 10 | 3 |
| SSG | 11 | 4 |
Table 2.2. Estimated numbers of quasars
computed using the luminosity functions of Fan et al. (2001a), and
Schneider, Schmidt & Gunn (1995).
All quasars 5.8<z<7.2, Y<19.0 are selected by the criteria
shown in Figure 2.3 (right). Beyond z=7.2 quasars redden rapidly in
Y-J. The Y magnitude limit is set by the i'-Y>3 colour selection
limit, and by the i'=22 limit of the Sloan survey i.e. we are picking
the very brightest quasars in this redshift range, which are
of course the most valuable for absorption-line spectroscopy. We can
compute the expected numbers using the latest luminosity function of
Fan et al. (2001a), as well as the older luminosity function of
Schneider, Schmidt & Gunn (1995), based on lower-redshift data. The
results are provided in Table 2.2. By surveying 4000 sq. degs we can
expect to find 10 quasars at 5.8<z<7.2. These numbers can easily
be increased when deeper i' data become available. More interestingly,
as explained in the appendix, one can envisage extending this work up
to redshift z=8 (and beyond) with very deep widefield data in the z'
filter, reaching to z'=22.7. With imaging to this depth over 4000
sq. degs, then a survey to J=19.5 would be expected to find 3 to 4
quasars in the redshift interval 7.2<z<8.


